STATE OF MOTOR DEVELOPMENT OF SCHOOL CHILDREN AGED 7,5 - 19,5 FROM KUJAWY - POMORZE REGION
Marek Napierala
Department of Physical Education Bydgoszcz Academy
Annotation. The gathered material presents the state of motor development of school children aged 7,5 - 19,5 in Kujawy - Pomorze region (Poland) and the results achieved will help compare Polish results with these of European countries, especially European Union, to which we aspire. It can be made easier by the use of International Fitness Test. The state and changes of motor efficiency of children and young people become an element of educational strategy and national health policy.
Key words: motor development, International Fitness Test.
Анотацiя. Марек Наперала. Стан рухового розвитку школярiв у вiцi 7,5 - 19,5 у Kujawy - Pomorze региона. Зiбраний матерiал представляе стан рухового розвитку школярiв у вiцi 7,5 - 19,5 у Kujawy - Pomorze регiону. Отриманi результати допоможуть порiвняти фiзичний розвиток школярiв Польщi i Европейських краiн, особливо Европейського Союзу, до якого ми прагнемо. Це може бути зроблено за допомогою Мiжнародного тесту Фитнесса. Стан i змiни руховоi ефективностi дiтей i молодих людей стануть елементом освiтньоi стратегii i нацiональноi полiтики здоров'я.
Ключовi слова: руховий розвиток, Мiжнародний тест Фитнесса.
Аннотация. Марек Наперала. Состояние двигательного развития школьников в возрасте 7,5 - 19,5 в Kujawy - Pomorze региона. Собранный материал представляет состояние двигательного развития школьников в возрасте 7,5 - 19,5 в Kujawy - Pomorze региона. Полученные результаты помогут сравнить физическое развитие школьников Польши и Европейских стран, особенно Европейского Союза, к которому мы стремимся. Это может быть сделано при помощи Международного теста Фитнесса. Состояние и изменения двигательной эффективности детей и молодых людей станет элементом образовательной стратегии и национальной политики здоровья.
Ключевые слова: двигательное развитие, Международный тест Фитнесса.
Introduction
A number of investigators in Poland and all over the world have lately observed the occurrence of decreasing of physical activity of a man. Physical efficiency of young generation systematically decreases. Wish to secure physical health, improvement of motor development draw attention of research workers, sports circles and decidents of social - political life to essential tasks of physical education and pro-healthy culture of the contemporary society.
A healthy man is a man of motor efficiency. Efficiency is also expression of motor resource of a man, evidence of better adjustment to living conditions and performing different social roles. Healthy and physically efficient youth is a desirable social value. Fitness is a positive evidence of health read (according to WHO definition) not as the lack of illness but as many - sided value of the human constitution (Przeweda, Trzesniowski 1996).
Children of limited resource of motor habits and little fitness generally adapt worse to school demands and duties. Exercises have direct effect on improving physical and mental health, children can blow off their excessive steam, and so they can better withstand stresses and frustration, and good motor development secures the child feeling of safety, satisfaction and independence.
The state and changes in motor development of children and young people become an element of educational strategy and pro-healthy policy of the state. Findings of contemporary studies on state of health of young people show urgent need for taking up actions aiming at changing this unfavourable state. The direction and range of the changes are pointed out by various, comprehensive studies on fitness and motor efficiency of the youth (Napierala 2000).
The aim of carried out tests is to determine the state of development of motor abilities of school children from Kujawy - Pomorze region (Poland). Results obtained can be compared with other results of tests in Poland and in other European countries, especially these belonging to European Union, to which we aspire.
Findings will help define precisely new tasks for teachers of physical education in didactic - educational school schedule, regarding the model of school physical culture. Presented material should become important information of school children, afford possibilities for correcting and creating more valuable programmes applying to individual students as well as whole groups. It will also afford possibilities for defining tasks concerning planning the development of material base of physical education, selecting young people for record - seeking sports, and may become universal way of appointing school children straying away from the norm.
The material and the method
Tests were carried out among school children of all types of schools from Kujawy - Pomorze region, aged 7,5 - 19,5. They were carried out in the year 2001 in urban and rural schools, with participation of students of physical education, also studying at estra-mural course, sports teachers - in realizing the inquiry. All investigators were instructed in compliance with the directions of the inquiry, which they had all been given. Findings were statistically worked out. Only healthy children, with no contraindications for physical exercise were tested.
To indicate the state of
motor abilities the tests of International Fitness Test were used. Arithmetic means of the
results were presented tabularly and graphically and converted to points of T - scale. The
significance of differences between the average results in particular age groups were
appointed by Student test and critical values were read on the substance level ![]() = 0,05 (tp= 1,96) i
= 0,05 (tp= 1,96) i ![]() = 0,01 (tp=2,58). The pace of
development between particular tests was appointed by Mollison’s rate.
= 0,01 (tp=2,58). The pace of
development between particular tests was appointed by Mollison’s rate.
Analysis of motor abilities
In testing motor abilities almost at each successive test better results were made a note of. Between particular tests, especially at the initial stage of investigation, the differences proved statistically essential at the tested levels.
In 50 m run we can observe betterment of results and up to the age of 17,5 (boys) and 14,5 (girls) the differences between particular tests are statistically essential at both levels. The results of both boys and girls show that the time of covering 50 m distance is shorter than in all - Polish tests (boys - 46,5 points, girls - 46,5 points). The greatest development of speed both in case of boys and girls occurred between the age of 10,5 and 11,5.
In 600 m and 800m run (girls) and 600 m and 1000 m run (boys) results systematically improve. Differences between tests on boys are in majority statistically essential, while in case of girls significance of differences occurs at the age up to 15,5. The tested boys from Kujawy - Pomorze region scored 49,7 points, so the result close to all-Polish average. Girls scored 46 points and they yield precedence to their co-evals from all-Polish tests by 4 points. The highest increase was observed between the tested aged 8,5 - 9,5.
The tested achieved better and better results in 4 x 10 m backward and forward run (except for two final tests of girls). Up to the age of 13,5 there occur greatest differences between tests (essential at the tested levels). Boys scored 49,4 points on the average, girls - 50,8 points and proved better than girls of the same age from all - Polish tests. The highest rate of nimbleness was achieved by boys aged 12,5 - 13,5, while by girls aged between 7,5 - 8,5 and 10,5 - 11,5. Worsening of the results in case of girls occurs over the age of 14,5. Graphic presentation of the backward and forward run results at particular age in diagram 3.
The number of recumbent sit-ups in 30’ time increases systematically up to the age of 13,5, later there appear certain ups and downs of results. Statistically essential differences appear from the age 7,5 to 15,5 (boys) and up to the age of 12,5 (girls). Comparing the results of tests with all-Polish tests, both boys and girls proved better than their co-evals. The tested girls (53,5 points) turned out better than boys (51,5 points). The greatest rate of pace of development occurred between the age 7,5 - 8,5.
In bar hang (boys over 12,5 years of age - pull up) despite systematical improvement of the results, both boys and girls stray away from their co-evals from all-Polish tests. The differences, statistically essential, between testing boys are considerably differentiated (table 5), whereas in case of girls these differences occur between tests at the age of 7,5 - 10,5. The greatest rate of pace of development was observed between the age 14,5 - 15,5 (boys) and 9,5 - 10,5 (girls). Girls scored 49,5 points and proved better than their co-evals who gained only 46,6 points.
Muscle strength of palm flexors measured by Collin’s dynamometer appeared greater at each test and more favourable for boys. Statistically essential differences appeared almost between all tests of boys, whereas in case of girls - up to the age of 14,5. Both boys and girls achieved average results measured by T - scale, over 50 points (50,3 - boys, 52,9 - girls). The greatest pace of development measured by Mollison’s rate occurred between the age of 7,5 - 9,5.
While testing flexibility of sacral - lumbar segment of spine, girls showed better capacity than their co-evals. Rarely, though more frequently in case of girls, there occurs significance of differences between the tests (table 7). Converting to points according to T - scale boys achieved 48,9 points, while girls - 50,2. The greatest pace of development of boys occurs between the age 7,5 - 8,5, whereas in case of girls between the age of 8,5 - 9,5.
Stand still long jump served to appoint explosive strength of lower limbs. The results undergo systematic improvement (except the last tests). Differences statistically essential occur between the majority of tests of boys and half of the tests of girls (table 8). Results of the tests converted to points of T - scale did not project beyond 50 points and amount to 47,3 points (boys) and 48,3 points (girls). The greatest pace of development of the tested quality occurred in boys aged between 16,5 - 17,5, and in girls between 7,5 - 8,5.
Table 1
50 m run, standing start (s), [N - number, P- points, M - Molison’s rate].
Age |
Boys |
Girls |
||||||||||||
N |
|
|
|
t |
P |
M |
N |
|
|
|
t |
P |
M |
|
7,5 |
706 | 11,20 | 1,49 | 43 |
710 | 11,49 | 1,52 | 44 |
||||||
8,5 |
894 | 10,76 | 1,53 | 0,44 | 5,84** | 43 |
0,29 | 771 | 11,04 | 1,41 | 0,45 | 5,88** | 46 |
0,32 |
9,5 |
860 | 10,33 | 1,45 | 0,43 | 6,01** | 44 |
0,30 | 887 | 10,57 | 1,63 | 0,47 | 6,33** | 45 |
0,29 |
10,5 |
1010 | 9,71 | 1,45 | 0,62 | 9,23** | 46 |
0,43 | 1016 | 10,26 | 1,45 | 0,31 | 4,39** | 43 |
0,21 |
11,5 |
701 | 8,97 | 0,83 | 0,74 | 13,36** | 50 |
0,89 | 776 | 9,36 | 0,76 | 0,90 | 16,82** | 49 |
1,18 |
12,5 |
751 | 8,90 | 0,95 | 0,07 | 1,64 | 48 |
0,07 | 698 | 9,21 | 0,76 | 0,15 | 3,92** | 47 |
0,20 |
13,5 |
828 | 8,72 | 0,72 | 0,18 | 4,29** | 46 |
0,25 | 795 | 9,11 | 0,87 | 0,10 | 2,42* | 46 |
0,11 |
14,5 |
663 | 8,17 | 0,81 | 0,55 | 13,61** | 49 |
0,68 | 570 | 8,93 | 0,68 | 0,18 | 4,07** | 47 |
0,26 |
15,5 |
819 | 7,85 | 0,85 | 0,32 | 7,35** | 47 |
0,38 | 546 | 8,87 | 0,78 | 0,06 | 1,51 | 47 |
0,08 |
16,5 |
789 | 7,71 | 0,69 | 0,14 | 3,56** | 47 |
0,20 | 604 | 8,82 | 0,71 | 0,05 | 1,13 | 49 |
0,07 |
17,5 |
821 | 7,59 | 0,83 | 0,12 | 3,11** | 47 |
0,14 | 495 | 8,89 | 0,57 | 0,07 | 1,85 | 47 |
-0,12 |
18,5 |
739 | 7,55 | 0,77 | 0,04 | 1,12 | 47 |
0,05 | 546 | 8,88 | 0,90 | 0,01 | 0,11 | 47 |
0,01 |
19,5 |
716 |
7,51 | 0,74 | 0,04 | 1,01 | 47 |
0,05 | 634 | 8,93 | 0,65 | 0,05 | 0,89 | 48 |
-0,08 |
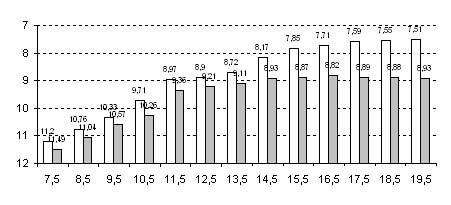
Diagram 1. Graphic presentation of 50 m run time, standing start (s); boys (white colour), girls (grey colour).
Table 2
600 m run and 800m run (s) of girls aged 7,5 - 11,5 and 1000 m run of boys aged 12,5 - 19,5 (s), [N - number, P- points, M - Molison’s rate].
Age |
Boys |
Girls |
||||||||||||
N |
|
|
|
t |
P |
M |
N |
|
|
|
t |
P |
M |
|
7,5 |
723 | 203,11 | 38,15 | 45 |
788 | 218,67 | 40,26 | 43 |
||||||
8,5 |
858 | 192,32 | 27,87 | 10,79 | 6,31** | 45 | 0,39 | 721 | 204,72 | 29,58 | 13,95 | 7,71** | 45 | 0,47 |
9,5 |
877 | 181,09 | 30,02 | 11,23 | 8,08** | 46 | 0,37 | 835 | 187,71 | 29,65 | 17,01 | 11,30** | 48 | 0,57 |
10,5 |
1010 | 167,30 | 29,64 | 13,79 | 10,01** | 48 | 0,47 | 685 | 175,85 | 41,75 | 11,86 | 6,25** | 50 | 0,28 |
11,5 |
931 | 153,76 | 23,81 | 13,54 | 11,14** | 52 | 0,57 | 771 | 165,85 | 26,60 | 10,00 | 5,38** | 52 | 0,38 |
12,5 |
1052 | 254,07 | 57,80 | 54 | 572 | 244,99 | 33,93 | 44 | ||||||
13,5 |
1619 | 252,00 | 51,70 | 2,07 | 0,95 | 50 | 0,04 | 805 | 233,78 | 37,69 | 11,21 | 5,77** | 47 | 0,30 |
14,5 |
1468 | 236,68 | 49,19 | 15,32 | 8,43** | 52 | 0,31 | 517 | 233,63 | 36,09 | 0,15 | 0,07 | 47 | 0,004 |
15,5 |
1242 | 234,35 | 32,43 | 2,33 | 1,48 | 50 | 0,07 | 486 | 240,19 | 33,27 | 6,56 | 3,00** | 45 | -0,20 |
16,5 |
1292 | 219,71 | 45,46 | 14,64 | 9,36** | 54 | 0,32 | 505 | 242,93 | 38,30 | 2,74 | 1,20 | 45 | -0,07 |
17,5 |
1319 | 225,50 | 30,17 | 5,79 | 3,83** | 50 | -0,19 | 524 | 245,18 | 31,54 | 2,25 | 1,03 | 45 | -0,07 |
18,5 |
1497 | 222,02 | 37,16 | 3,48 | 2,74** | 50 | 0,09 | 433 | 246,51 | 30,80 | 1,33 | 0,66 | 43 | -0,04 |
19,5 |
1250 | 222,09 | 35,00 | 0,07 | 0,05 | 50 | -0,002 | 510 | 248,35 | 38,04 | 1,84 | 0,82 | 44 | -0,05 |
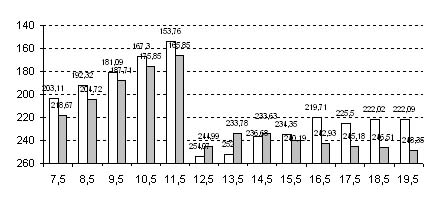
Diagram 2. Graphic presentation of 600m, 800m and 1000m run time of boys (white colour) and girls (grey colour)
Table 3
4x10m forward and backward run (s), [N - number, P- points, M - Molison’s rate].
Age |
Boys |
Girls |
||||||||||||
N |
|
|
|
t |
P |
M |
N |
|
|
|
t |
P |
M |
|
7,5 |
823 | 14,72 | 2,05 | 49 |
1205 |
15,06 | 1,64 | 50 |
||||||
8,5 |
668 | 14,29 | 1,91 | 0,43 | 4,19** | 48 | 0,23 | 1486 | 14,44 | 1,54 | 0,62 | 9,97** | 52 | 0,40 |
9,5 |
667 | 13,71 | 2,00 | 0,58 | 5,45** | 49 | 0,29 | 1550 | 14,05 | 1,81 | 0,39 | 6,41** | 51 | 0,22 |
10,5 |
613 | 13,32 | 1,77 | 0,39 | 3,69** | 50 | 0,22 | 1063 | 13,57 | 1,81 | 0,48 | 6,67** | 51 | 0,27 |
11,5 |
739 | 12,86 | 1,48 | 0,46 | 5,14** | 50 | 0,31 | 1121 | 12,96 | 1,51 | 0,61 | 8,61** | 53 | 0,40 |
12,5 |
595 | 12,50 | 1,65 | 0,36 | 4,18** | 51 | 0,22 | 1123 | 12,76 | 1,27 | 0,20 | 3,26** | 51 | 0,16 |
13,5 |
547 | 12,03 | 1,11 | 0,47 | 5,68** | 52 | 0,42 | 956 | 12,63 | 1,34 | 0,13 | 2,36** | 52 | 0,10 |
14,5 |
511 | 11,97 | 1,63 | 0,06 | 0,67 | 50 | 0,04 | 977 | 12,73 | 1,50 | 0,10 | 1,53 | 51 | -0,07 |
15,5 |
658 | 11,86 | 1,44 | 0,11 | 1,17 | 49 | 0,01 | 1106 | 12,75 | 1,41 | 0,02 | 0,40 | 51 | -0,01 |
16,5 |
607 | 11,84 | 1,30 | 0,02 | 0,25 | 48 | 0,08 | 934 | 12,77 | 1,40 | 0,02 | 0,22 | 50 | -0,01 |
17,5 |
600 | 11,75 | 1,36 | 0,09 | 1,21 | 48 | 0,07 | 868 | 12,77 | 1,55 | 0,00 | 0,09 | 50 | 0,00 |
18,5 |
606 | 11,52 | 1,42 | 0,23 | 2,89** | 49 | 0,06 | 841 | 12,83 | 1,37 | 0,06 | 0,83 | 50 | -0,04 |
19,5 |
399 | 11,48 | 1,58 | 0,04 | 0,40 | 49 | 0,03 | 612 | 12,87 | 1,57 | 0,04 | 0,52 | 49 | -0,03 |
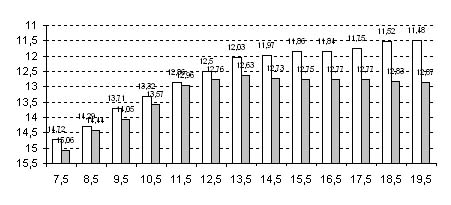
Diagram 3. Graphic presentation of 4x10m backward and forward run time (s) of boys (white colour) and girls (grey colour)
Table 4
Recumbent sit-ups in 30’ time (number of cycles), [N-number, P- points, M - Molison’s rate].
Age |
Boys |
Girls |
||||||||||||
N |
|
|
|
t |
P |
M |
N |
|
|
|
t |
P |
M |
|
7,5 |
931 | 15,08 | 5,62 | 49 |
914 | 14,01 | 5,79 | 50 |
||||||
8,5 |
999 | 17,88 | 5,62 | 2,80 | 10,93** | 52 | 0,50 | 1045 | 16,46 | 5,61 | 2,45 | 9,47** | 53 | 0,44 |
9,5 |
983 | 19,80 | 5,83 | 1,92 | 7,46** | 53 | 0,33 | 1006 | 18,59 | 5,79 | 2,13 | 8,46** | 54 | 0,37 |
10,5 |
1051 | 21,39 | 5,55 | 1,59 | 6,30** | 53 | 0,29 | 1081 | 19,69 | 5,79 | 1,10 | 4,30** | 54 | 0,19 |
11,5 |
997 | 22,87 | 4,94 | 1,48 | 6,36** | 53 | 0,30 | 1010 | 20,54 | 5,28 | 0,85 | 3,52** | 53 | 0,16 |
12,5 |
580 | 22,94 | 5,20 | 0,07 | 0,25 | 52 | 0,01 | 451 | 21,16 | 5,40 | 0,62 | 2,05* | 53 | 0,11 |
13,5 |
576 | 23,60 | 5,37 | 0,66 | 2,13* | 52 | 0,12 | 458 | 21,47 | 4,69 | 0,31 | 0,91 | 55 | 0,07 |
14,5 |
438 | 23,37 | 5,20 | 0,23 | 0,69 | 51 | -0,04 | 342 | 21,17 | 5,36 | 0,30 | 0,81 | 54 | -0,06 |
15,5 |
399 | 24,19 | 4,71 | 0,82 | 2,40* | 52 | 0,17 | 335 | 21,37 | 5,30 | 0,20 | 0,49 | 54 | 0,04 |
16,5 |
378 | 24,18 | 5,59 | 0,01 | 0,05 | 51 | 0,00 | 356 | 21,77 | 5,38 | 0,40 | 0,97 | 55 | 0,07 |
17,5 |
366 | 24,45 | 5,75 | 0,27 | 0,66 | 51 | 0,05 | 365 | 21,51 | 6,11 | 0,26 | 0,60 | 55 | -0,04 |
18,5 |
409 | 24,37 | 5,37 | 0,08 | 0,19 | 51 | -0,01 | 365 | 20,97 | 5,63 | 0,54 | 1,24 | 52 | -0,10 |
19,5 |
442 | 24,40 | 5,90 | 0,03 | 0,06 | 51 | 0,01 | 369 | 20,76 | 6,00 | 0,21 | 0,50 | 53 | -0,03 |
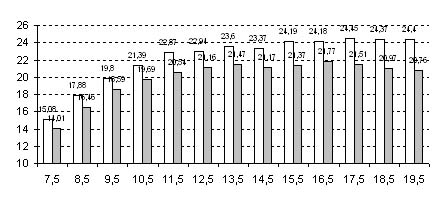
Diagram 4. Average number of recumbent sit-ups in 30’ time of boys (white colour) and girls (grey colour).
Table 5
Bar hang time (boys aged 12,5 - 19,5 - pull up), [N-number, P- points, M - Molison’s rate].
Age |
Boys |
Girls |
||||||||||||
N |
|
|
|
t |
P |
M |
N |
|
|
|
t |
P |
M |
|
7,5 |
791 | 12,46 | 11,86 | 49 |
687 | 10,50 | 9,26 | 49 |
||||||
8,5 |
907 | 15,19 | 13,26 | 2,73 | 4,48** | 49 | 0,21 | 798 | 11,63 | 11,93 | 1,13 | 2,05* | 50 | 0,09 |
9,5 |
909 | 16,55 | 13,73 | 1,36 | 2,15* | 47 | 0,10 | 910 | 13,12 | 10,79 | 1,49 | 2,70** | 50 | 0,14 |
10,5 |
786 | 17,53 | 11,90 | 0,98 | 1,58 | 48 | 0,07 | 985 | 15,42 | 8,90 | 2,30 | 5,03** | 51 | 0,26 |
11,5 |
820 | 18,29 | 13,70 | 0,76 | 1,18 | 47 | 0,07 | 816 | 15,54 | 10,12 | 0,12 | 0,27 | 50 | 0,02 |
12,5 |
464 | 2,36 | 3,42 | 45 | 361 | 13,98 | 15,38 | 1,56 | 1,76 | 49 | -0,14 | |||
13,5 |
380 | 2,65 | 3,14 | 0,30 | 1,31 | 44 | 0,09 | 369 | 13,98 | 14,18 | 0,00 | 0,00 | 49 | 0,04 |
14,5 |
419 | 3,48 | 3,45 | 0,83 | 3,55** | 44 | 0,24 | 366 | 14,07 | 13,73 | 0,09 | 0,09 | 49 | 0,01 |
15,5 |
532 | 4,61 | 3,56 | 1,13 | 4,93** | 46 | 0,32 | 397 | 12,72 | 13,56 | 1,35 | 1,36 | 49 | -0,10 |
16,5 |
552 | 5,39 | 3,74 | 0,78 | 3,53** | 47 | 0,21 | 406 | 12,68 | 12,84 | 0,04 | 0,04 | 50 | 0,00 |
17,5 |
429 | 5,92 | 4,00 | 0,53 | 2,11* | 46 | 0,13 | 359 | 12,34 | 12,55 | 0,34 | 0,37 | 49 | -0,03 |
18,5 |
430 | 6,20 | 3,13 | 0,28 | 1,13 | 46 | 0,09 | 347 | 11,69 | 13,79 | 0,65 | 0,65 | 50 | -0,05 |
19,5 |
401 | 7,23 | 3,86 | 1,03 | 4,22** | 48 | 0,27 | 359 | 11,77 | 12,65 | 0,08 | 0,08 | 48 | 0,01 |
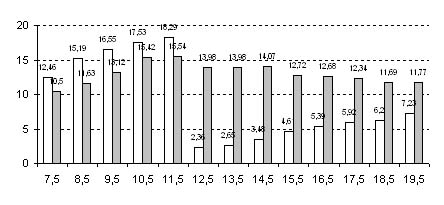
Diagram 5. Average bar hang time and pull up time of boys (white colour) and girls (grey colour).
Table 6
Collin’s dynamometer clench (kG), [N - number, P- points, M - Molison’s rate].
Age |
Boys |
Girls |
||||||||||||
N |
|
|
|
t |
P |
M |
N |
|
|
|
t |
P |
M |
|
7,5 |
727 | 11,95 | 2,55 | 50 |
609 | 11,42 | 2,28 | 63 |
||||||
8,5 |
822 | 14,71 | 2,28 | 2,76 | 22,33** | 53 | 1,21 | 570 | 13,44 | 2,09 | 2,02 | 15,85** | 55 | 0,97 |
9,5 |
990 | 18,15 | 2,44 | 3,44 | 31,05** | 55 | 1,41 | 569 | 15,32 | 2,03 | 1,88 | 15,44** | 54 | 0,93 |
10,5 |
718 | 18,62 | 2,58 | 0,47 | 3,78** | 51 | 0,18 | 617 | 16,19 | 3,02 | 0,87 | 5,82** | 52 | 0,29 |
11,5 |
751 | 20,54 | 2,87 | 1,92 | 13,49** | 51 | 0,67 | 603 | 18,02 | 2,59 | 1,83 | 11,40** | 52 | 0,71 |
12,5 |
342 | 21,81 | 6,29 | 1,27 | 3,58** | 48 | 0,20 | 374 | 20,09 | 4,03 | 2,07 | 8,86** | 50 | 0,51 |
13,5 |
355 | 26,19 | 7,15 | 4,38 | 8,58** | 49 | 0,61 | 402 | 21,99 | 5,12 | 1,90 | 5,78** | 48 | 0,37 |
14,5 |
355 | 32,38 | 8,25 | 6,19 | 10,68** | 49 | 0,75 | 303 | 25,58 | 5,40 | 3,59 | 8,92** | 51 | 0,66 |
15,5 |
366 | 38,06 | 9,78 | 5,68 | 8,45** | 49 | 0,58 | 371 | 26,21 | 6,54 | 0,63 | 1,38 | 51 | 0,10 |
16,5 |
421 | 43,28 | 10,52 | 5,22 | 7,20** | 49 | 0,50 | 400 | 27,39 | 6,87 | 1,18 | 2,44* | 52 | 0,17 |
17,5 |
365 | 47,68 | 10,59 | 4,40 | 5,83** | 51 | 0,42 | 310 | 28,65 | 7,31 | 1,26 | 2,34* | 53 | 0,17 |
18,5 |
347 | 49,30 | 10,85 | 1,62 | 2,01* | 50 | 0,15 | 323 | 29,75 | 7,91 | 1,10 | 1,82 | 55 | 0,14 |
19,5 |
343 | 49,55 | 12,29 | 0,25 | 0,28 | 49 | 0,02 | 327 | 30,45 | 7,57 | 0,70 | 1,15 | 52 | 0,09 |
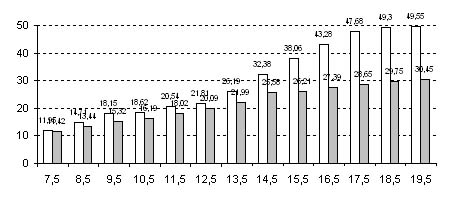
Diagram 6. Collin’s dynamometer clench - average values (kG) of boys (white colour) and girls (grey colour).
Table 7
Bend forward (cm), [N - number, P- points, M - Molison’s rate].
Age |
Boys |
Girls |
||||||||||||
N |
|
|
|
t |
P |
M | N |
|
|
|
t |
P |
M |
|
7,5 |
735 | 0,46 | 5,17 | 48 |
943 | 1,51 | 5,08 | 48 |
||||||
8,5 |
760 | 2,04 | 4,59 | 1,58 | 6,25** | 51 | 0,34 | 1006 | 2,77 | 5,03 | 1,26 | 5,50** | 50 | 0,25 |
9,5 |
891 | 2,39 | 4,87 | 0,35 | 1,53 | 50 | 0,07 | 1121 | 4,30 | 5,49 | 1,53 | 6,68** | 52 | 0,28 |
10,5 |
851 | 2,53 | 4,57 | 0,14 | 0,62 | 50 | 0,03 | 814 | 4,58 | 5,05 | 0,28 | 1,18 | 52 | 0,06 |
11,5 |
969 | 3,06 | 6,24 | 0,52 | 2,05* | 51 | 0,08 | 1046 | 4,91 | 6,08 | 0,33 | 1,26 | 51 | 0,05 |
12,5 |
472 | 3,29 | 6,26 | 0,23 | 0,66 | 51 | 0,04 | 517 | 5,90 | 5,61 | 0,99 | 3,22** | 51 | 0,18 |
13,5 |
494 | 3,37 | 6,29 | 0,08 | 0,21 | 50 | 0,01 | 471 | 6,79 | 5,72 | 0,89 | 2,46* | 49 | 0,16 |
14,5 |
349 | 3,55 | 6,81 | 0,18 | 0,38 | 49 | 0,03 | 364 | 7,57 | 6,15 | 0,78 | 1,86 | 49 | 0,13 |
15,5 |
371 | 4,49 | 7,21 | 0,94 | 1,80 | 48 | 0,13 | 335 | 9,13 | 6,53 | 1,56 | 3,25** | 50 | 0,24 |
16,5 |
343 | 5,14 | 7,63 | 0,65 | 1,16 | 47 | 0,09 | 375 | 9,46 | 6,52 | 0,33 | 0,68 | 49 | 0,05 |
17,5 |
333 | 5,84 | 7,91 | 0,70 | 1,17 | 47 | 0,09 | 332 | 10,14 | 6,60 | 0,68 | 1,38 | 50 | 0,10 |
18,5 |
375 | 6,92 | 8,09 | 1,08 | 1,79 | 47 | 0,13 | 302 | 10,93 | 7,22 | 0,79 | 1,43 | 51 | 0,11 |
19,5 |
333 | 6,86 | 8,18 | 0,06 | 0,10 | 47 | 0,01 | 344 | 11,02 | 7,54 | 0,09 | 0,16 | 50 | 0,01 |
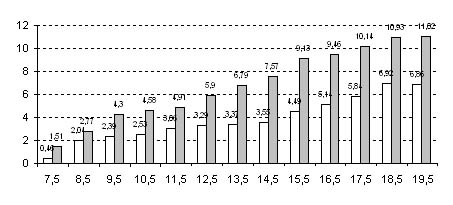
Diagram 7. Bend forwerd (cm) of boys (white colour) and girls (grey colour).
Table 8
Stand still long jumps (cm), [N-number, P- points, M - Molison’s rate].
Age |
Boys |
Girls |
||||||||||||
N |
|
|
|
t |
P |
M | N |
|
|
|
t |
P |
M | |
7,5 |
899 | 124,96 | 19,62 | 47 |
928 | 114,53 | 30,09 | 45 |
||||||
8,5 |
788 | 130,58 | 23,06 | 5,62 | 5,35** | 46 | 0,24 | 1018 | 127,57 | 19,18 | 13,04 | 11,28** | 48 | 0,68 |
9,5 |
830 | 147,98 | 21,90 | 17,40 | 15,55** | 50 | 0,79 | 828 | 139,62 | 19,45 | 12,05 | 13,32** | 50 | 0,62 |
10,5 |
645 | 154,54 | 20,02 | 6,56 | 5,99** | 49 | 0,31 | 799 | 147,44 | 20,28 | 7,82 | 7,94** | 49 | 0,39 |
11,5 |
739 | 167,52 | 20,76 | 12,98 | 11,82** | 52 | 0,64 | 743 | 162,09 | 19,66 | 14,65 | 14,40** | 52 | 0,75 |
12,5 |
532 | 167,83 | 25,62 | 0,31 | 0,23 | 47 | 0,01 | 461 | 162,75 | 20,71 | 0,66 | 0,55 | 48 | 0,03 |
13,5 |
568 | 175,67 | 33,96 | 7,84 | 4,34** | 46 | 0,23 | 366 | 166,03 | 19,93 | 3,28 | 2,31* | 47 | 0,16 |
14,5 |
532 | 189,28 | 19,94 | 13,61 | 8,16** | 46 | 0,68 | 331 | 170,85 | 16,92 | 4,82 | 3,45** | 48 | 0,28 |
15,5 |
358 | 202,23 | 20,98 | 12,95 | 9,21** | 46 | 0,62 | 372 | 172,55 | 42,85 | 1,70 | 0,71 | 48 | 0,04 |
16,5 |
407 | 206,78 | 21,31 | 4,55 | 2,98** | 43 | 0,21 | 349 | 175,67 | 18,76 | 3,12 | 1,28 | 48 | 0,17 |
17,5 |
405 | 220,55 | 17,24 | 13,77 | 10,12** | 47 | 0,80 | 395 | 176,78 | 15,68 | 1,11 | 0,88 | 48 | 0,07 |
18,5 |
364 | 228,41 | 16,67 | 7,86 | 6,42** | 49 | 0,47 | 412 | 179,01 | 14,13 | 2,23 | 2,12* | 49 | 0,16 |
19,5 |
389 | 225,85 | 15,71 | 2,56 | 2,17* | 47 | -0,16 | 290 | 178,81 | 14,04 | 0,20 | 0,19 | 48 | -0,01 |
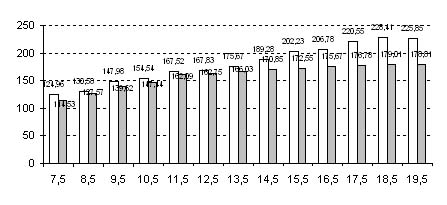
Diagram 8. Stand still long jump (cm) of boys (white colour) and girls (grey colour).
Conclusions
Results of the carried out tests entitle to draw the following conclusions:
1. At each test of motor
efficiency both boys and girls show improvement of results. Differences between particular
tests, especially in first years of investigation, are statistically essential at tested
levels ![]() =0,05 and
=0,05 and ![]() =0,01.
=0,01.
2. In trials of International Fitness Test girls proved better, achieving 49,7 point in T - scale while boys - 48,8 points.
3. Both boys and girls demonstrate lower efficiency than their co-evals from all-Polish tests.
Bibliography
1. Napierala M.P., 2000, A child from Kujawy - Pomorze region. Physical and motor development of elementary class children, Wydawnictwo Uczelniane Akademii Bydgoskiej, Bydgoszcz.
2. Pilicz S., Przeweda R., Trzesniowski R., 1993, Point scales for valuating physical efficiency of Polish youth, AWF Warszawa.
3. Przeweda R., Trzesniowski R., 1996, Physical efficiency of Polish youth in the light of studies from the year 1989, AWF Warszawa.
Поступила в редакцию 23.07.2002г.